InSAR and PSInSAR
Synthetic Aperture Radar (SAR) is a powerful remote
sensing system, enabling observations of the Earth’s surface day or night,
in all weather conditions from airborne platforms and from space. Unlike
optical remote sensing systems, which rely on the Sun for illumination, SAR
provides its own, illumination via microwave (Radar frequency) transmissions
from the satellite. These transmissions are coherent, meaning that
both amplitude and phase information are retained. The Sun’s illumination
reaching the Earth is incoherent (scrambled), meaning that only amplitude
information can be used. This leads to another important difference between
optical and SAR systems. In many cases, the coherent phase information
transmitted by a SAR satellite or aircraft is reflected from the surface
back to the sensor with the phase more or less intact. A subsequent
satellite pass, several days to several years after the initial pass, may
also retain the phase information. A phase comparison of the two images
via interferometric techniques may reveal subtle shifts in the position of
the Earth’s surface (closer to or farther from the satellite). This
technique is known as Interferometrtic SAR (InSAR). It can be done
from either aircraft or spacecraft, but for most scientific applications,
space-based platforms are preffered
The potential precision of InSAR depends on many things (e.g., the accuracy
of the orbit determination for the two satellites passes, atmospheric conditions
that affect the phase delay) but in principle the surface displacement measurement
can have a precision of 2%-5% of the SAR wavelength. Typical SAR wavelengths
are in the range 3-30 cm, implying millimeter to centimeter precision in
surface displacement between two satellite passes. Refinements of this
basic technique include “stacking” of multiple SAR passes to reduce noise.
InSAR has been used to study co-seismic offsets due to earthquakes, volcano
deformation, and subsidence due to withdrawal of ground water, oil, or natural
gas (see reviews by Massonett and Feigl, 1998, and Rosen et al, 2000).
 |
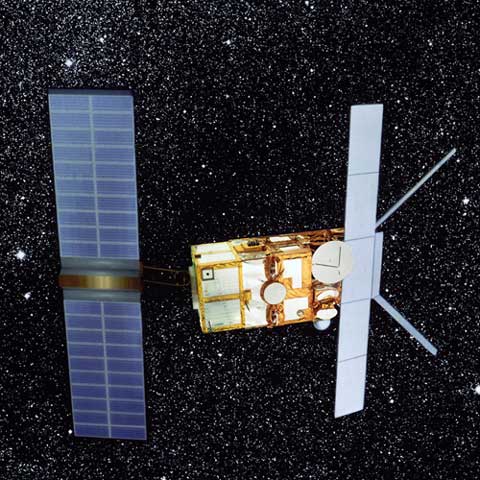
Figure 1
Sketch of the ERS-2 satellite, a primary source of SAR data for many scientific
investigations. Note the large array of solar panels on the left,
necessary to supply power to this active imaging system. The large panel
on the right is the SAR antenna, which has the dual role of illuminating
the Earth's surface with microwave energy, and receiving the resulting backscattered
signal. |
How SAR Works:
|
Figure 2
Cartoon illustrating some of the basic principles of SAR interferometry.
The right hand inset show two satellites illuminating the same region of
the Earth. In practice, a single satellite illuminates the area, followed
several weeks to years later with a second image from the same satellite
in the same nominal orbit. Displacement of the Earth's surface between the
two successive satellite passes is estimated, following principles illustrated
in the left hand side of the figure. The two basic requirements are that
the orbits of both satellite passes are known precisely, and that the phase
information inherent in the SAR signal is exploited (electro-optical satellites,
using the visible and infra-red portion of the electomagnetic spectrum, utilize
only amplitude information; SAR uses both amplitude and phase). Then phase
information from the two satellite passes (each of which in effect is a
type of distance measurement) is used to estimate the change in distance
(range change) between the two passes, in the direction of the satellite
line of site ("look angle"). This means that the measurement is inherently
scalar. The use of both ascending and descending passes can be used to determine
a two dimensional vector measurement. |
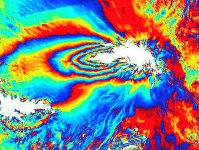 |
Figure 3
Interferogram from Tungaraghua volcano in Ecuador | Figure 3
Interferogram from Tungaraghua volcano in Ecuador -->
Permanent Scatterer InSAR (PSInSAR)
While InSAR is a powerful technique for measuring changes in the Earth’s
surface, it does have limitations. These include temporal and geometrical
decorrelation (low signal to noise ratio in the phase change estimate),
and variable tropospheric water vapor, which can generate variable phase
delay due to the impact of water vapor on the propagation speed of microwave
signals. The corresponding phase changes can be misinterpreted as surface
change. The effects can be quite large, especially in tropical and
sub-tropical regions. In tropical regions, up to 10 cm of variable
path delay over several weeks has been observed [Dixon and Kornreich-Wolfe, 1990; Dixon et al.,
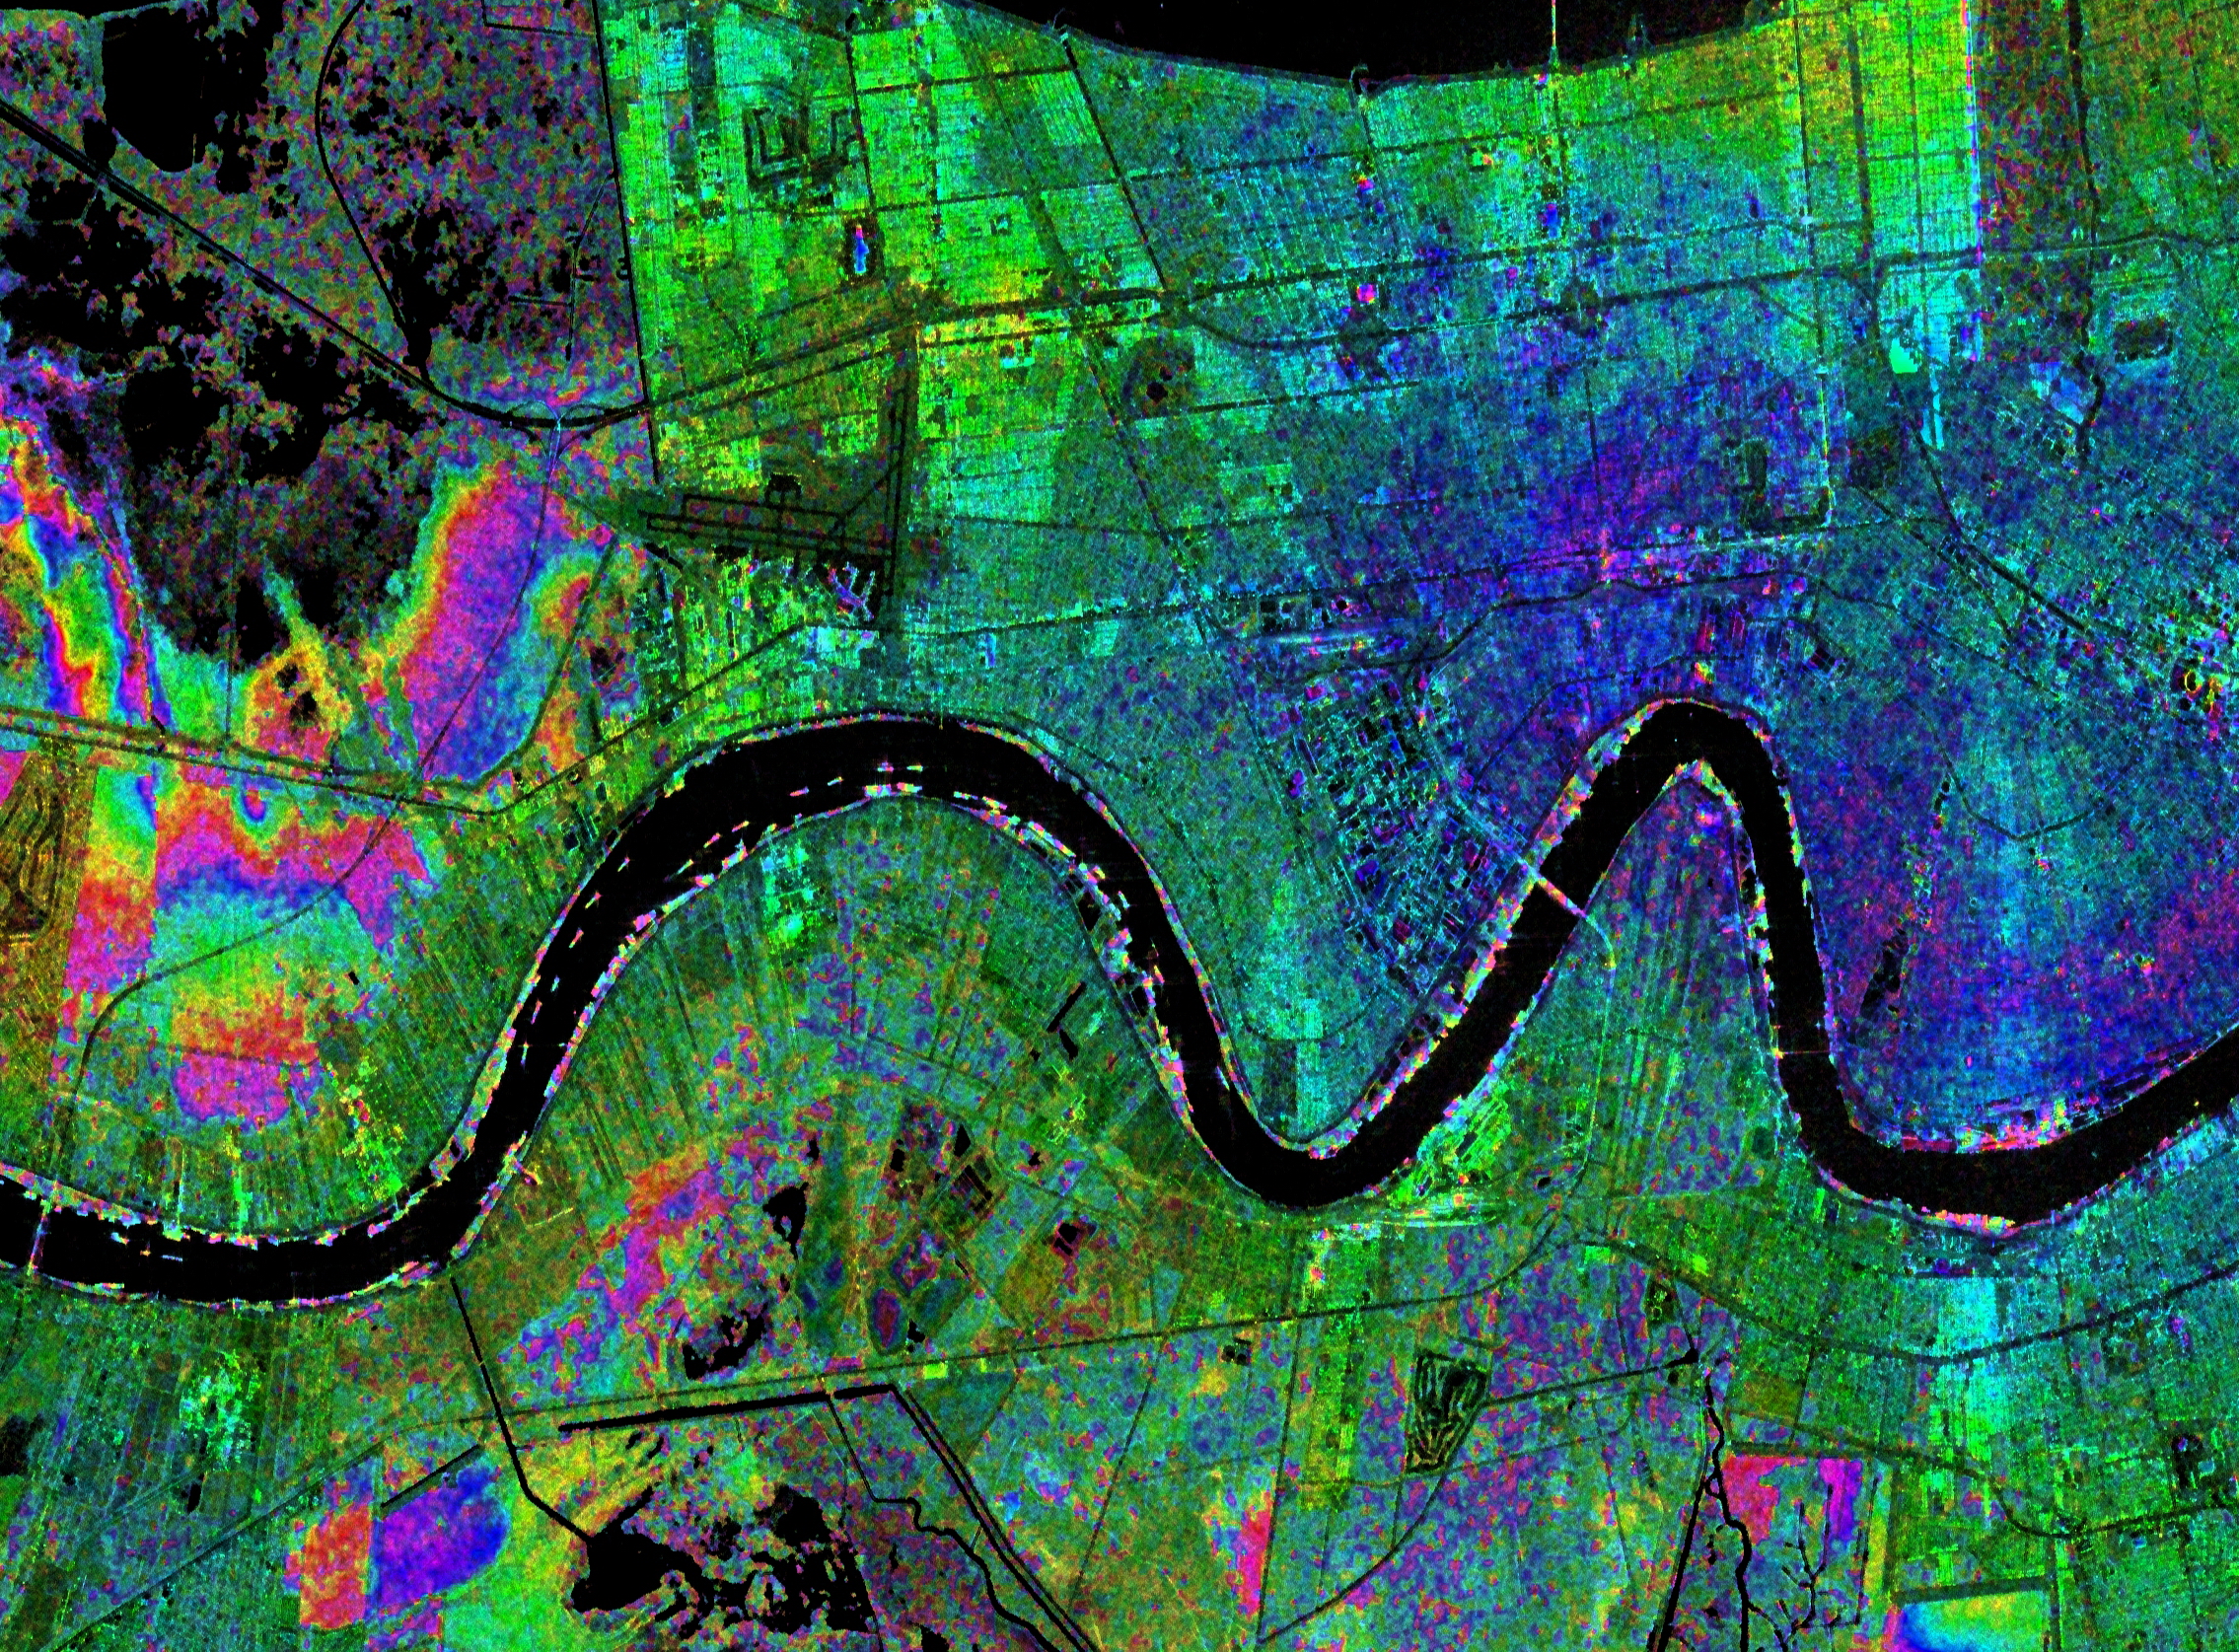
1991]. An example of a tropospheric water vapor “signal” in
a SAR interferogram in sub-tropical New Orleans is shown in Figure 4.
Although the water vapor signal is only about 6 mm, the passes are separated
by just 3 weeks, implying an annual average subsidence rate in excess of
100 mm/yr. The average subsidence rate here is known to be about 6
mm/yr, so clearly the tropospheric error can be significant.
Permanent Scatterer InSAR (PSInSAR) [Ferretti et al., 2000, 2001;2004; Colesanti et
al., 2003a,b,c] exploits several characteristics of radar scattering
and atmospheric decorrelation to measure surface displacement in otherwise
non-optimum conditions. Atmospheric phase contributions are spatially
correlated within a single SAR scene, but tend to be uncorrelated on time
scales of days to weeks. Conversely, surface motion is usually strongly correlated
in time. An example is surface subsidence, which is usually steady
over periods of months and sometimes years. Thus, atmospheric effects can
be estimated and removed by combining data from long time series of SAR images,
averaging out the temporal fluctuations. Radar scatterers that are
only slightly affected by temporal and geometrical decorrelation are used,
allowing exploitation of all available images regardless of imaging geometry.
In this sense the scatterers are “permanent”, i.e., persistent over many
satellite revolutions (the technique is also known as Persistent Scatterer
InSAR).
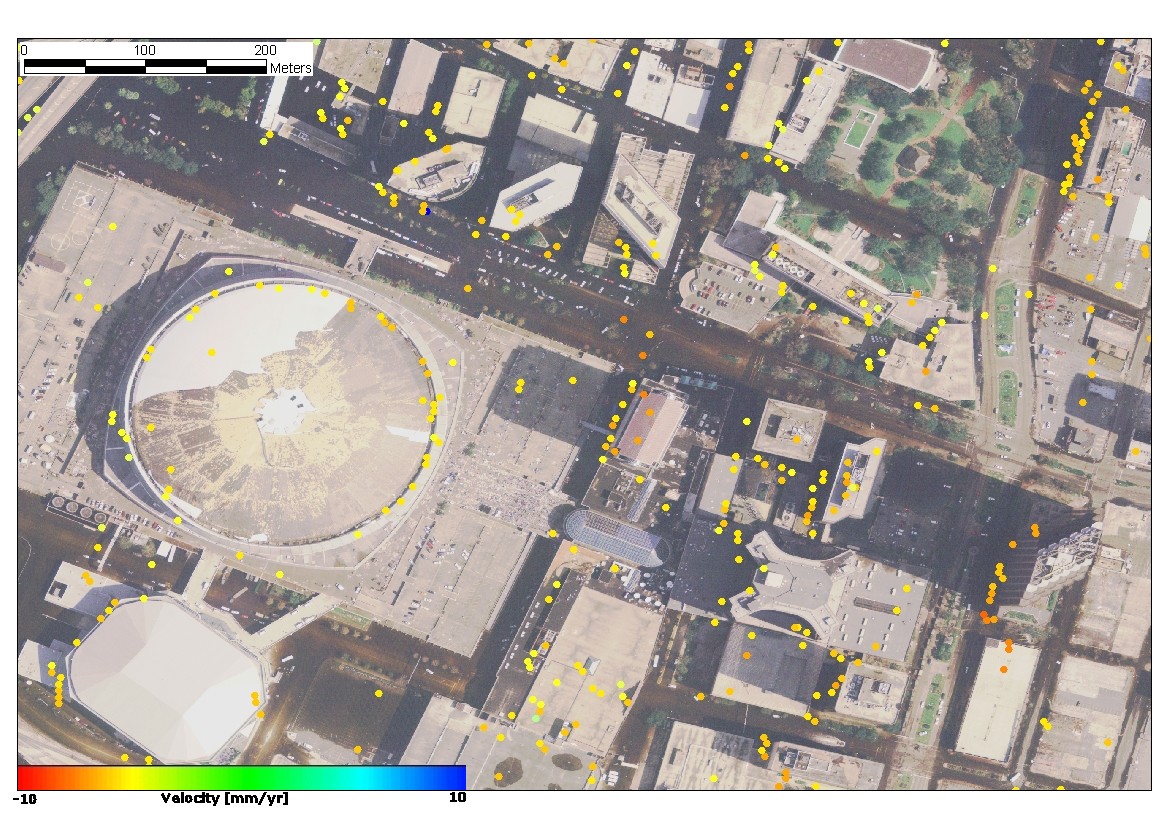
What constitutes a permanent or persistent scatterer? Man made structures
in urban settings are most common. Inspection of the individual
scatterers in a PSInSAR image of New Orleans indicates that many of the
scatterers are located at the intersection of a street or sidewalk and vertical
structure such as the side of a building, or a roof (Figure 5). In
contrast, parks and other vegetated areas have no permanent scatterers, presumably
because vegetation is not a strong radar reflector, and also undergoes significant
wind-driven motion as well as growth over the imaging period (in this case,
three years). This implies that the PSInSAR technique is ideally suited
to studying surface changes in urban areas, e.g., due to subsidence or co-seismic
offsets.
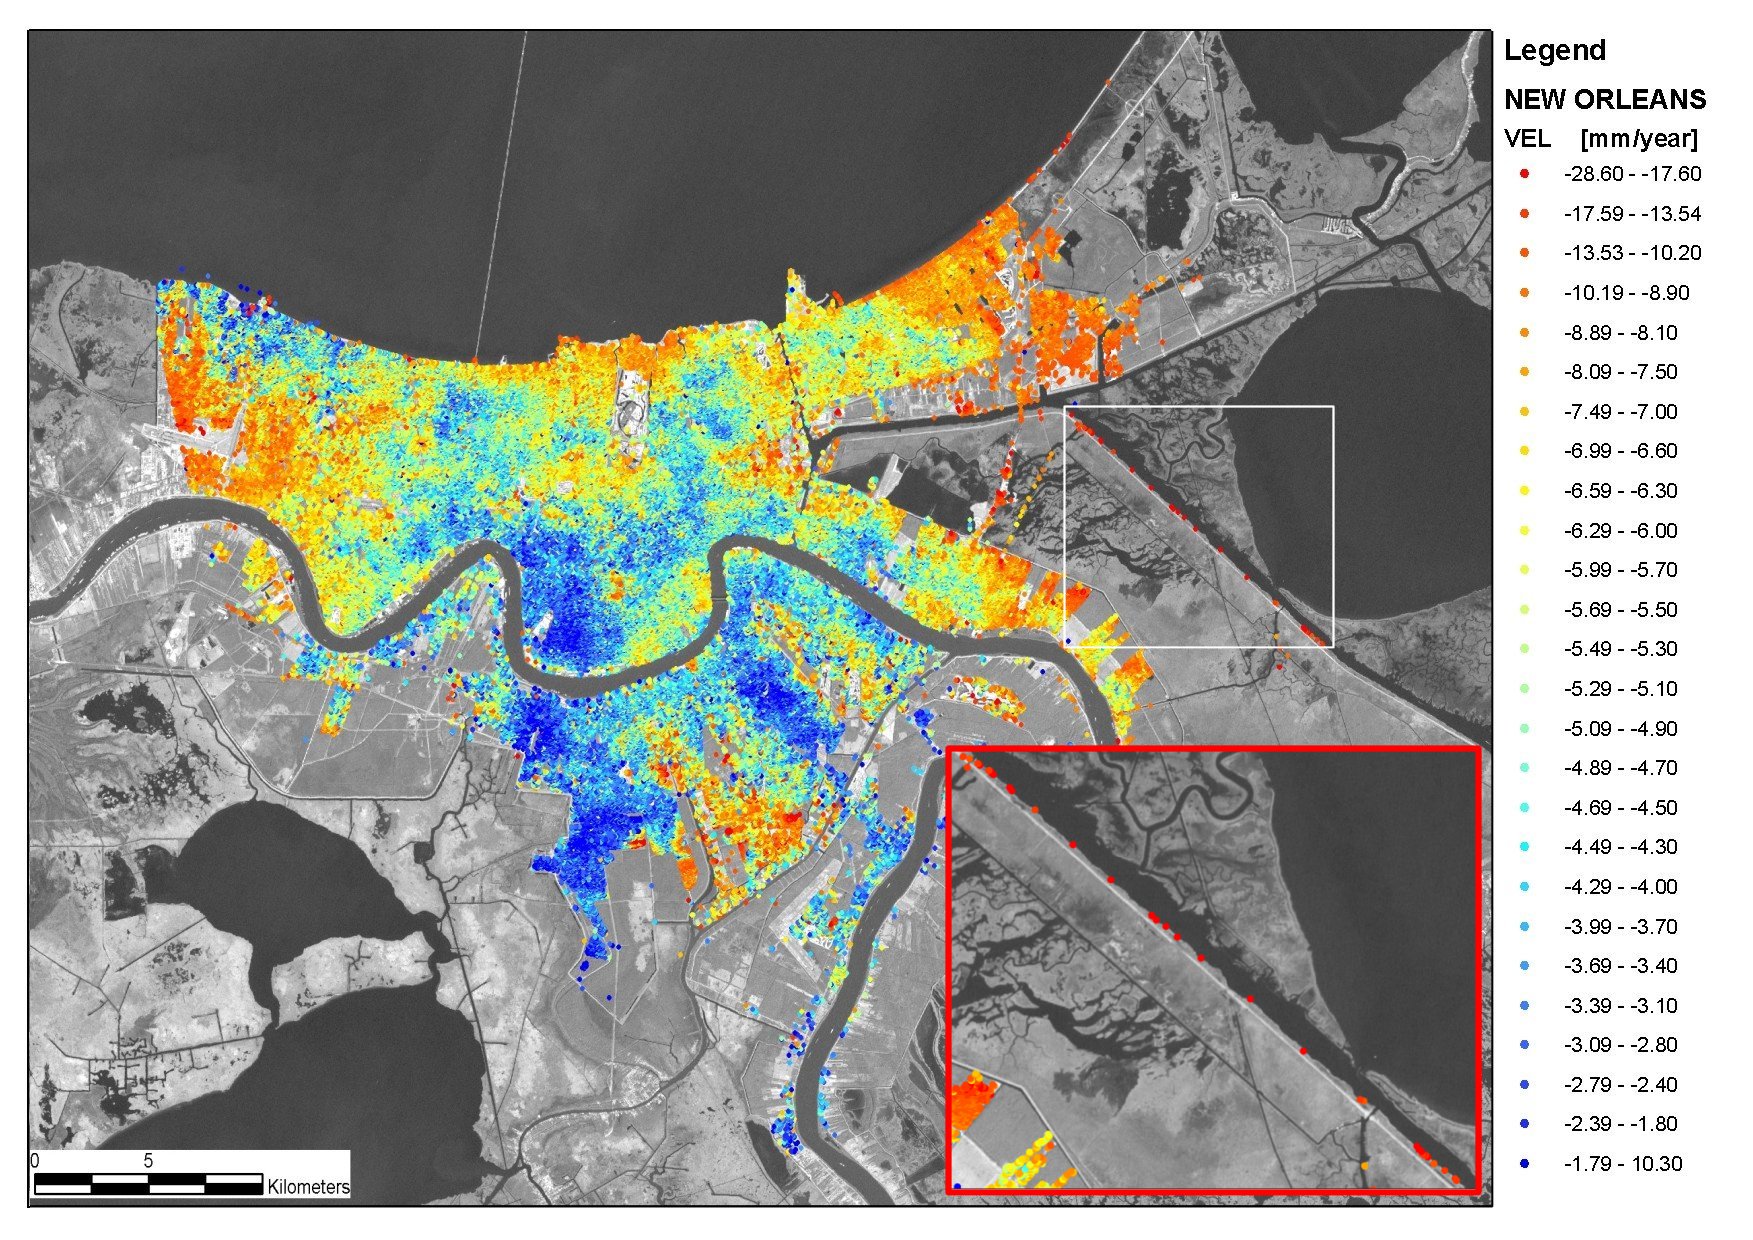
We used the PSInSAR technique to study subsidence in New Orleans [Dixon et al., 2006]. We used 33 RADARSAT
(6 cm wavelength) scenes acquired between April 2002 and July 2005 in the
ascending orbit, standard beam mode (S-2). A total of more than 1.8x10⁵
radar targets were identified that retained some phase coherence over the
three year study period, providing excellent spatial resolution for our
space-derived surface velocity map (Figure 6). Both InSAR and PSInSAR are
by definition relative (ambiguous), hence determination of the actual subsidence
rate requires calibration with one or more ground control points of known
elevation and motion. This is usually accomplished by referencing
to stable areas ~50 km away from the locus of deformation, where motions
are assumed to be minimal. This is problematic in the Gulf coast,
where a large region is thought to be subsiding. We use a ten year
time series from a high precision GPS station in the greater New Orleans
area (ENG1) to provide an independent reference.
The mean and standard deviation range change rate for all the point targets
is -5.6±2.5 mm/yr. The range change measurement is in the radar line
of site direction, but can be considered nearly equivalent to vertical subsidence.
The inset to Figure 6 shows an expanded view of one of the levees in the
eastern part of New Orleans that failed during Hurricane Katrina (Figure
7). These levees have high subsidence rates (in excess of 20 mm/yr) and there
may be a relation between high subsidence rates and levee failure, e.g, the
underlying substrate may be weak.
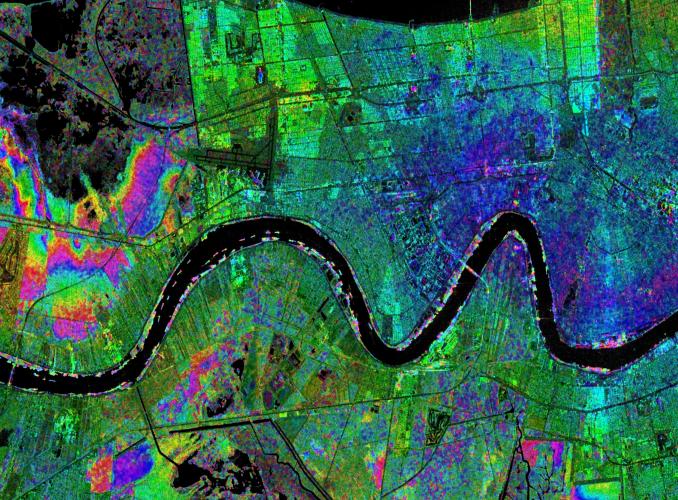 |
Figure 4
Synthetic Aperture Radar (SAR)
interferogram superimposed on a SAR amplitude image of the greater New Orleans
area and Mississippi River. The interferogram represents phase changes in
two SAR images between February 5 and March 1, 2005, , reflecting the 24-day
repeat cycle of the satellite orbit. One color cycle (red-yellow-green-blue)
in the interferogram represents 28-mm of range change between the ground
surface and the radar antenna. Color changes on the west (left) side of the
image represent level changes spanning 24 days southwest of the airport. The
magenta pattern near the center of image could reflect soil moisture-related
land subsidence, or more likely atmospheric effects over the same time period.
These and other studies were discussed in sessions G14A and G23A (Hydrology
from Space) and G43A (Subsidence of South-Central North America) at the
Spring 2005 meeting of the American Geophysical Union, held in New Orleans.
Radarsat data courtesy of the Canadian Space Agency, distributed by Radarsat
International. Data were downloaded and processed at CSTARS (Center for
Southeastern Tropical Remote Sensing), University of Miami. Interferometric
processing by S. Kim, University of Miami.
|
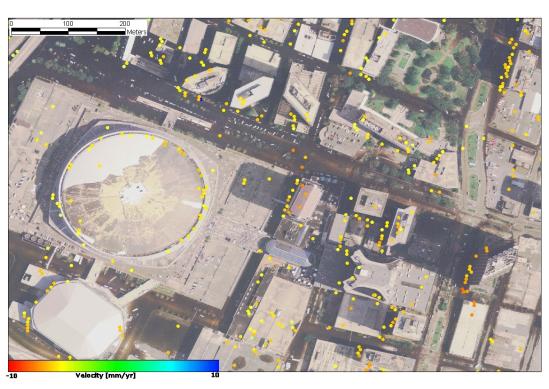 |
Figure 5
Close up of Superdome near downtown New Orleans from aerial photography
after Hurricane Katrina (note damaged roof of Superdome), with superimposed
velocity of permanent scatterers. Radar illumination from left, solar illumination
from right. |
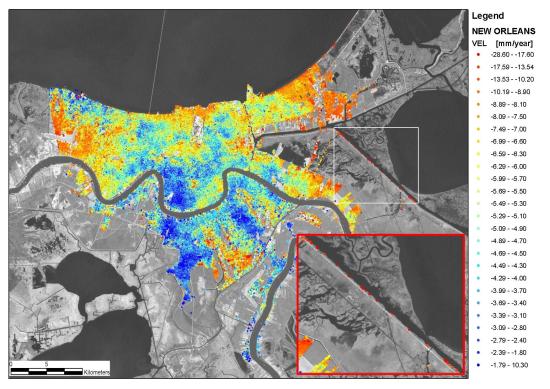
Figure 6
Velocity map for permanent
scatterers in New Orleans and vicinity.
Values are range change in direction of radar illumination.
Negative values indicate motion away from satellite,
consistent with subsidence. Int. Airpt. is location of International
Airport, MRGO is Mississippi River-Gulf Outlet Canal. Inset
(location marked by white rectangle) shows close up of PS velocity
map for eastern St Bernard’s parish and western Lake Borgne. Note
high rates of subsidence on levee bounding MRGO Canal. Large sections
of the MRGO levee were breached during Hurricane Katrina in
August 29, 2005. From Dixon et al. [2006].
|
 |
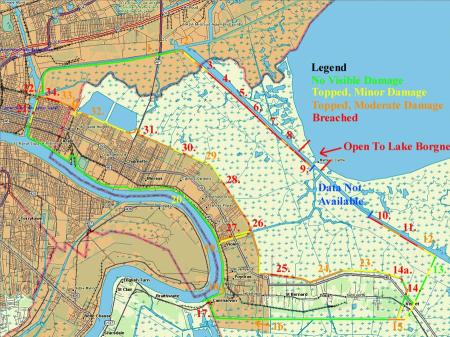 |
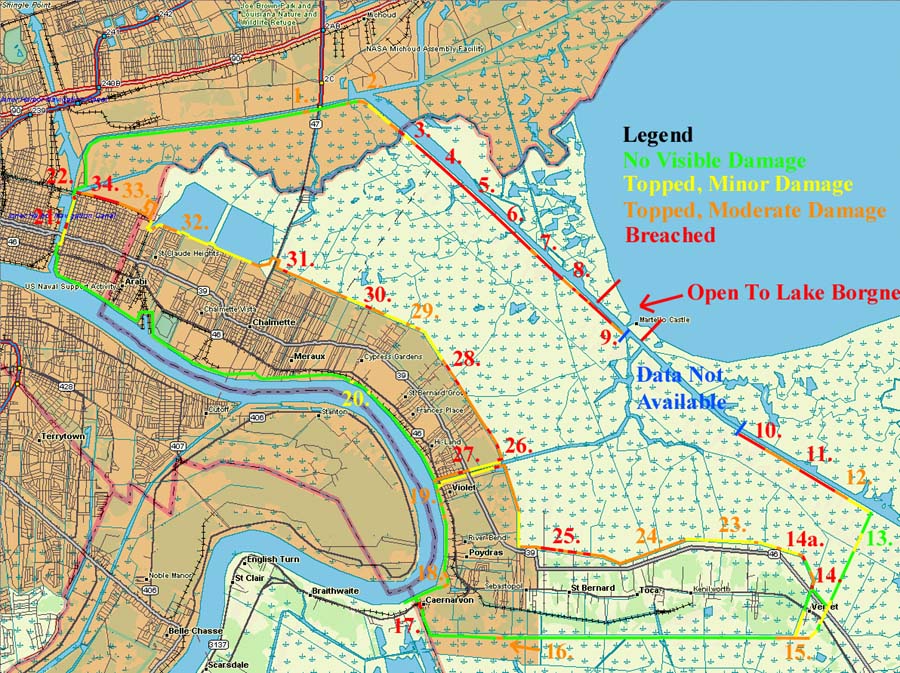
Figure 7
Map of breached levees in St Bernard Parish, from Free Republic.
Note breached levees along MRGO (points 3-9), corresponding to radar scatterers
with high subsidence rates.
|
For more information on the InSAR technique, see:
Massonnet, D. and K. Feigl, Radar interferometry and its
application to changes in the Earth's surface. Rev. Geophys. 36, 441-500
(1998).
Rosen, P.A. et al.; Synthetic aperture radar interferometry. Proc.
IEEE 88(3), 333-382 (2000).
Hanssen, R.F., Radar Interferometry, Kluwer Academic Publishers (2001).
References on InSAR-measured subsidence:
Massonnet, D., T. Holzer, and H. Vadon, Land subsidence cause by East
Mesa geothermal field, California, observed using SAR interferometry, Geophys.
Res. Lett. 24, 901-904 (1997).
Galloway, D. L., K. W. Hudnut, S. E. Ingebritsen, S. P. Phillips, G. Pelzer,
F. Rogez, P. A. Rosen, InSAR detection of system compaction and land subsidence,
Antelope Valley, Mojave Desert, California. Water Resources Res. 34, 2573-2585
(1998).
Fielding, E. J., R. G. Blom, R. M. Goldstein, Rapid subsidence over oil
fields measured by SAR interferometry. Geophys. Res. Lett. 25, 3215-3219 (1998).
Amelung, F., D. L. Galloway, J. W. Bell, H. A. Zebker, R. J. Laczniak,
Sensing the ups ad downs of Las Vegas: InSAR reveals structural control of
land subsidence and acquifer system deformation. Geology 27, 483-486 (1999).
Bawden, G. W., W. Thatcher, R. S. Stein, K. W. Hudnut and G. Peltzer,
Tectonic contraction across Los Angeles after removal of groundwater pumping
effects. Nature 412, 812-815 (2001).
Buckley, S.M., Rosen, P.A., Hensley, S. & Tapley, B.D., Land subsidence
in Houston, Texas, measured by radar interferometry and constrained by extensometers.
J. Geophys. Res.-Solid Earth 108(B11) (2003).
Tesauro, M. et al., Urban subsidence inside the city of Napoli (Italy)
observed by satellite radar interferometry. Geophys. Res. Lett 27(13): 1961-1964
(2000).
PSInSAR References:
Colesanti, C., A. Ferretti, F. Novali, C. Prati, and
F. Rocca, SAR monitoring of progressive and seasonal ground deformation
using the permanent scatterers technique. IEEE Trans. Geosci. Remote Sensing,
41(7), 1685-1701 (2003a).
Colesanti, C., A. Ferretti, C. Prati, and F. Rocca, Monitoring landslides
and tectonic motions with the permanent scatterer technique, Engineering
Geol., Spec. Issue Remote Sensing and Monitoring of Landslides, 68(1), 3-14
(2003b).
Colesanti, C. , Ferretti, A., Locatelli, R., Novali, F., Savio, G., Permanent
scatterers: precision assessment and multi-platform analysis. Int. Geosci.
Remote Sensing Symp., Tolouse, France (2003c).
Ferretti, F., C. Prati and F. Rocca, Nonlinear subsidence rate estimation
using permanent scatterers in differential SAR Interferometry. IEEE Trans.
Geoscience Remote Sensing 38(5), 2202-2212 (2000). Ferretti, C. Prati, and
F. Rocca, Permanent scatterers in SAR Interferometry. IEEE Trans. Geosci.
Remote Sensing, 39(1), 8-20 (2001).
Ferretti, F., F. Novali, R. Burgmann, G. Hilley and C. Prati, InSAR Permanent
Scatterer analysis reveals ups and downs in San Francisco Bay area. EOS,
85(34), 1-3 (2004).
Troposphere Effects:
Dixon, T. H., and S. Kornreich Wolf, Some tests of wet tropospheric calibration
for the CASA UNO Global Positioning System experiment. Geophys. Res. Lett.
17, p.203-206 (1990).
Dixon, T. H., G. Gonzalez, S. Lichten and E. Katsigris, First epoch geodetic
measurements with the Global Positioning System across the northern Caribbean
plate boundary zone. J. Geophys. Res. 96, 2397-2415 (1991).
Complete Listing of Geodesy Lab Publications