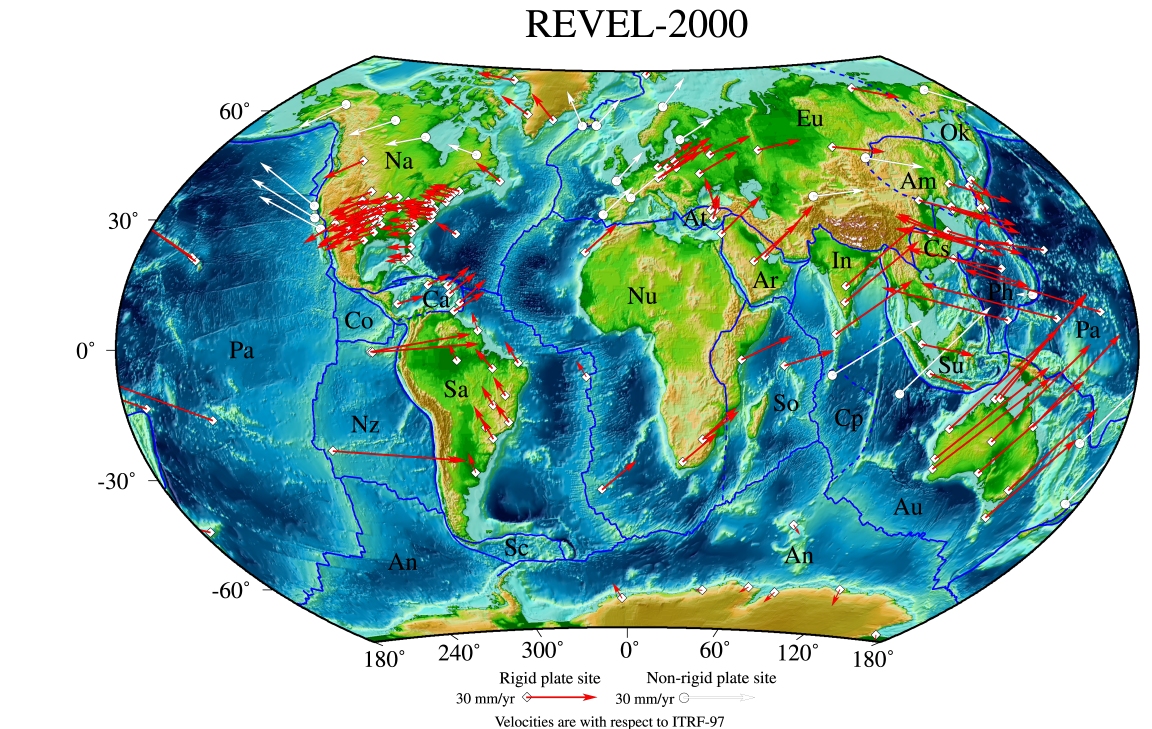
GPS site velocities in the ITRF-97 reference frame. Red vectors represent sites in stable plate interiors, used to generate the REVEL (Recent Velocity) plate motion model. White vectors represent sites in deforming plate boundary zones, and are not used in the model, but included for illustration. Note for example the two white vectors in eastern and western Iceland, showing divergence at this mid-ocean spreading center of about 2 cm/yr. Map is in Winkel Tripel projection.
1. Plate Motion
The present-day motion of Earths’s lithospheric plates (the Earth’s rigid outer shell) is important for many geological and geophysical studies, including seismic processes and earthquake hazard, as well as studies of mountain building and other geological processes. A comprehensive picture of plate motion averaged over the last ~ 3 million years comes from studies of magnetic anomalies (“stripes”) on the ocean floor near mid-ocean ridges. However, present day velocities might be slower or faster than this 3 million year average. Space geodetic techniques like GPS can give an accurate picture of today’s plate motion.
One of our findings is that Nazca-South America motion (the process responsible for building the Andes mountain chain) is slower than predicted by the 3 million year average [Norabuena et al., 1998, 1999; Sella et al., 2002]. This may reflect the growing influence of the Andes root, which deepens as the mountain chain grows, and imparts drag on the subducting (downgoing) Nazca plate. If correct, this means that the process of mountain building contains “the seeds of its own demise”. We are currently testing this hypothesis with colleagues at Ludwig Maximillians University in Munich, Germany [Iaffaldano et al., 2006].