|
If the boundaries were weak or frictionless, we probably would not have earthquakes. But friction at the boundaries of the plates causes them to stick together, at least for a period of time (sometimes hundreds of years). During this period, stresses build up, deforming the edges of the plates. Eventually however, the stresses build up to a point where they overcome the frictional strength of the rocks in the plate boundary zone, and the rocks snap back abruptly to their “pre-stuck” position. The abrupt movement of rocks constitutes the earthquake. The rapid motion of the rocks generates seismic waves much like rapid motion of your hand generates waves in a stretched out slinky. The seismic waves can travel around the Earth, sometimes causing damage far from the initial location of the earthquake. This process is nicely illustrated in a video from the IRIS web site (below).
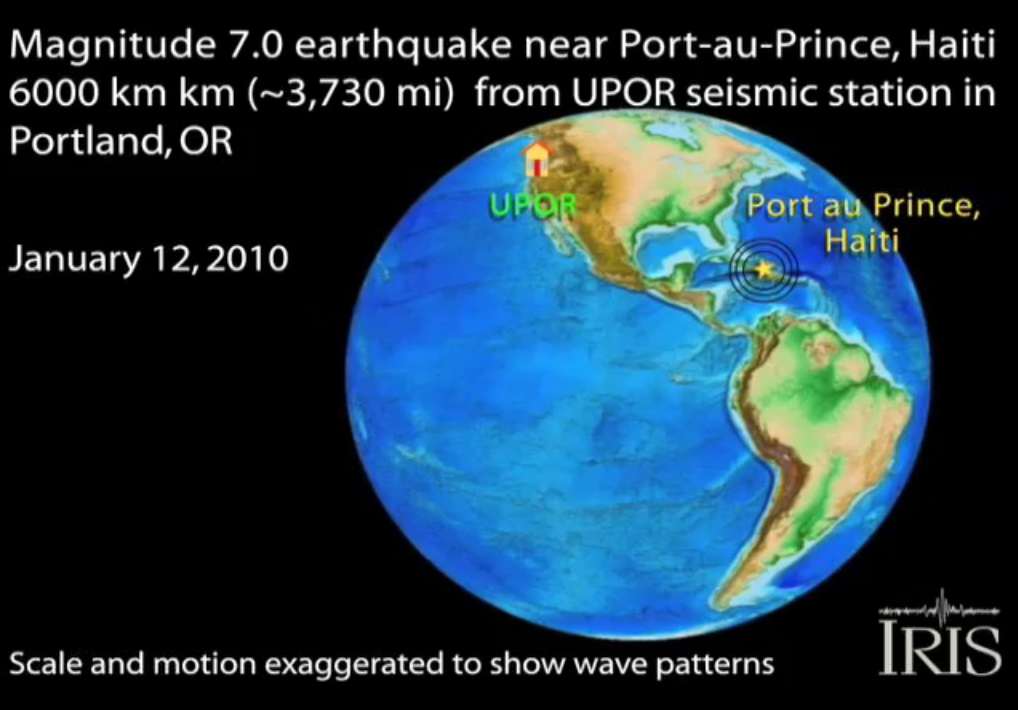
Figure 3. Cartoon showing propogation of seismic waves from the recent Haiti earthquake (courtesy of IRIS).
This simple explanation for earthquakes is often called the “stick-slip” hypothesis, and was first articulated in 1910 by H. H. Reid, a geologist studying the 1906 San Francisco earthquake. It can be illustrated with a brick and a spring. Put the brick on the floor and attach the spring to it (e.g., with duct tape). Slowly pull on the spring (this is the “stick” portion of the cycle) note that initially the brick does not move; it is “stuck” to the floor, due to friction. Your arm, which is doing the pulling, is simulating the slow, steady motion of the plates. Eventually, the stress in the spring builds to a point where it overcomes the frictional resistance, and the brick jumps forward (the “slip” part of the cycle which is the earthquake).
Earthquakes are caused by relative motion between Earth's plates. Ultimately, that motion is driven by convection in the Earth's mantle, the slow motion of fluid in the Earth's deep mantle that is the Earth's way of cooling off. If you've ever seen a lava lamp in action, you are observing convection. The heater at the base of the lamp provides the driving force. It warms the wax-like material in the lamp, converting it from a dense solid to a lower density state, causing it to rise. As it rises, it cools off, becoming more dense until is sinks again, and the process repeats. The Earth's plates are a bit like the wax as it nears the top of the lamp.
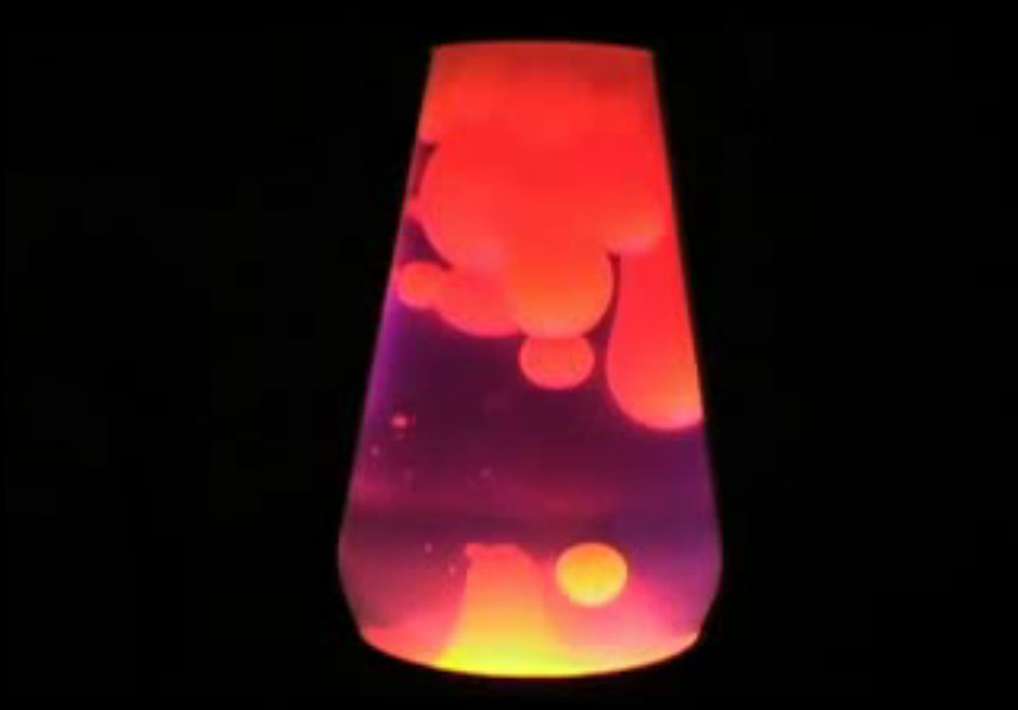
Figure 4. A lava lamp illustrates convection in the Earth's mantle.
Earthquakes can be classified by the directions of relative motion of the rocks across the faults.
When the rocks pull away from each other, the earthquake is called a normal fault earthquake.
If the rocks move toward each other, the earthquake is called a thrust fault earthquake. These earthquakes are often the largest and most destructive. Also, they can involve vertical motion of the Earth’s surface, as one plate or block rides up and over the other one. If this occurs underwater, this can cause a tsunami. Thrust faults occur in subduction zones, where one plate is pushed beneath another. The 2007 Pisco Peru earthquake is an example.
If the rocks move sideways relative to each other, the earthquake is called a strike slip earthquake. Since no vertical motion is involved, tsunamis usually do not occur.
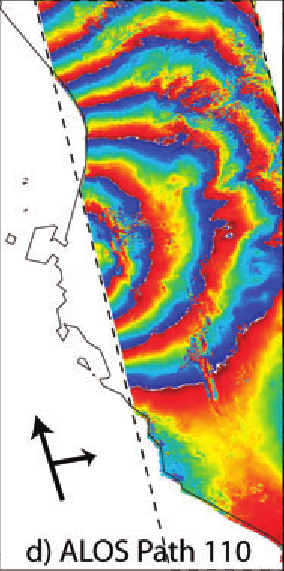
In August 2007 a major (M = 8) earthquake struck southern Peru. This was an example of a subduction zone earthquake, where the Nazca plate (beneath this part of the Pacific ocean) subducts beneath South America. InSAR has been used to study this event in great detail (Biggs et al., 2009).
On September 5, 2012, a Magnitude 7.6 earthquake occurred in the Nicoya Peninsula of northwestern Costa Rica, along a locked segment of the subduction boundary between the Cocos and Caribbean plates. These plates converge at approximately 8 cm/yr. The region has experienced numerous large (M>7) earthquakes, including similar events in 1853, 1900, and 1950 (M 7.8). The 1950 event is thought to have ruptured essentially the same part of the plate boundary as the 2012 event. In addition, a M 7.2 event in 1978 occurred roughly 10 km north-northeast of the 2012 event, and a M 7.3 event occurred roughly 50 km east-southeast in 1990.
In many subduction zones, the locus of seismic slip lies far offshore, making it challenging to infer seismic processes from on-shore observations. In contrast, the Nicoya Peninsula lies quite close to the trench in this portion of the Middle America subduction zone, allowing observations to be made directly over the rupture zone of major earthquakes. This proximity has been exploited to make geodetic observations with high precision GPS, allowing a detailed picture of the pattern of locking on the plate interface, the dipping boundary between the downgoing Cocos plate and the overriding Caribbean plate [e.g., Norabuena et al., 2004]. It is the release of this “locked slip” that causes large earthquakes and tsunamis. A preliminary solution for slip that occurred on the fault plane during this Costa Rica earthquake, based on GPS data, is available here. Understanding the size and location of locked patches, and their subsequent release in earthquakes, can help us forecast and prepare for earthquakes.
The favorable observation geometry, combined with the frequency and apparent regularity of large earthquakes, has made the Nicoya Peninsula the focus of intense seismic and geodetic monitoring for more than two decades. The discovery of slow slip events and concurrent seismic tremor in other subduction zones, including Cascadia, Mexico and Japan, has also motivated geophysical monitoring in Nicoya [Outerbridge et al., 2010]. At least five slow slip and tremor events in the last decade have now been identified and characterized in this section of the Middle America Trench [Jiang et al., 2012].
USF currently operates a network of high precision, continuously recording GPS receivers in the Nicoya Peninsula, funded by NSF, installed and maintained in collaboration with UNAVCO, and OVSICORI, a university group in Costa Rica charged with natural hazard research and mitigation. A map of our stations, and the epicenter of the earthquake, is available here where Yellow represents a Permanent GPS site, red is a “Campaign” site (occupied periodically every one or two years for a few days, and the plus sign is the earthquake epicenter as computed by the USGS. The network characteristics are described in Outerbridge et al. [2010]. UC Santa Cruz operates a seismic network in the region, also in collaboration with OVSICORI. In addition, Georgia Tech has periodically re-occupied the network of campaign GPS sites to improve spatial sampling of the deformation signal. Campaign GPS observations were first made in Costa Rica in 1988, and have been continued episodically ever since. Data from the mid-1990’s are sufficiently precise to define deformation time series spanning a significant fraction of the earthquake cycle. Related projects in Nicaragua (University of Texas, Arlington) and southern Costa Rica and Panama (Penn State University) help to define the regional tectonic context. One interesting phenomenon in the region that may influence the pattern and timing of earthquakes is the northwest translation of the fore-arc block (basically, the real estate between the volcanic arc and the trench offshore) at rates between about 8 and 15 mm/yr. This phenomenon, possible driving forces, and implications for earthquake hazard, are described in La Femina et al. [2002; 2009].
Data from the various Nicoya networks will give an unprecedented image of the spatial extent and magnitude of the 2012 rupture, and the extent, magnitude and time variation of post-seismic processes. In addition, southwest motion of the fore-arc crust relative to the volcanic arc could unload northwest-striking vertical strike slip faults that accommodate motion of the fore-arc relative to the volcanic arc, stimulating subsequent seismic activity on these shallow crustal faults. Such events could actually be more damaging than the September 5 event, given their proximity to urban areas. Also, since it has been a long time since a major earthquake struck the region, it is possible that seismic shaking and crustal motion will stimulate volcanic activity in the nearby volcanic arc. Volcan Arenal and Rincon de la Vieja are closest to the earthquake’s epicenter, but Poas and Turrialba also bear watching. Turrialba’s fumarolic activity has been increasing since 2001, but this volcano has not experienced a major eruption since 1866, implying the possibility of significant volumes of stored magma.
The fact that the 2012 earthquake occurred essentially in the middle of our observation networks provides an incredible research opportunity. Data from the continuous GPS network is archived at UNAVCO and is publicly available. I encourage anyone with an interest in seismic processes and high precision geodetic data to use these data in their research (UNAVCO). Rapid time series analysis results from the ARIA project at the Jet Propulsion Lab. 5 Hz GPS data are also available for selected stations (see UNAVCO web site). These high rate position/displacement data can give important information on the high amplitude crustal displacements that happen in the immediate aftermath of an earthquake, a time when conventional seismometers can saturate (go off scale). This information is critical for understanding the stresses on buildings and other infrastructure during earthquakes. Special instruments (called strong motion recorders) are the preferred way to measure these signals, but may not always be available. High precision time series (based on high precision satellite ephemeris data) and other results will be posted to this website as they become available.
In addition to process-oriented research, there are more immediate hazard-related aspects for this event to be considered. The apparent rupture area of the earthquake is smaller than the locked patch we infer from recent GPS-based models, and rather deep (~ 40 km). This raises the possibility of a second earthquake in the near future, rupturing up-dip of the current event. Being shallower than the September 5 event, the subsequent event could be more damaging, and perhaps stimulate a tsunami (there was no significant tsunami associated with the September 5 event). The role of past and future slow slip events at relieving some of this accumulated strain is only poorly known.
A copy of this information, with references, can be downloaded here .
Preliminary coseismic offsets for the September 5, 2012 earthquake (Table 1) and displacements from Prior Slow Slip Events (Table 2) measured by the USF-OVSICORI C-GPS network.
Table 1. Surface displacement and uncertainty calculated for the 10 sites that were operating on both September 4th and September 6th 2012. The coseismic displacement is calculated as the difference of the average position of the GPS antenna on September 4th and the position on September 6th. Software: Precise Point Positioning using Gipsy 6.1, with orbits and x-files from JPL.
| STAZ | Lon | Lat | North (cm) | East (cm) | Up (cm) |
| CABA | -85.34 | 10.24 | -30.47 0.15 | -19.19 0.18 | -11.21 0.20 |
| EPZA | -85.57 | 10.14 | -19.34 0.15 | -9.49 0.18 | 27.09 0.20 |
| HATI | -85.71 | 10.29 | -9.29 0.21 | -6.26 0.27 | 11.30 0.90 |
| LAFE | -84.96 | 9.81 | -6.57 0.15 | -2.31 0.18 | 1.22 0.81 |
| LMNL | -85.05 | 10.27 | -15.84 0.15 | -15.34 0.18 | -6.91 0.57 |
| PUJE | -85.27 | 10.11 | -24.33 0.15 | -16.97 0.18 | -6.07 0.57 |
| PUMO | -84.97 | 10.06 | -10.05 0.15 | -12.52 0.18 | -5.12 0.69 |
| QSEC | -85.36 | 9.84 | -39.40 0.15 | -4.66 0.18 | 39.54 0.60 |
| SAJU | -85.71 | 10.07 | -25.34 0.15 | -34.29 0.18 | 43.90 0.63 |
| VERA | -84.87 | 10.85 | -6.51 0.18 | -4.57 0.21 | -0.57 0.75 |
|