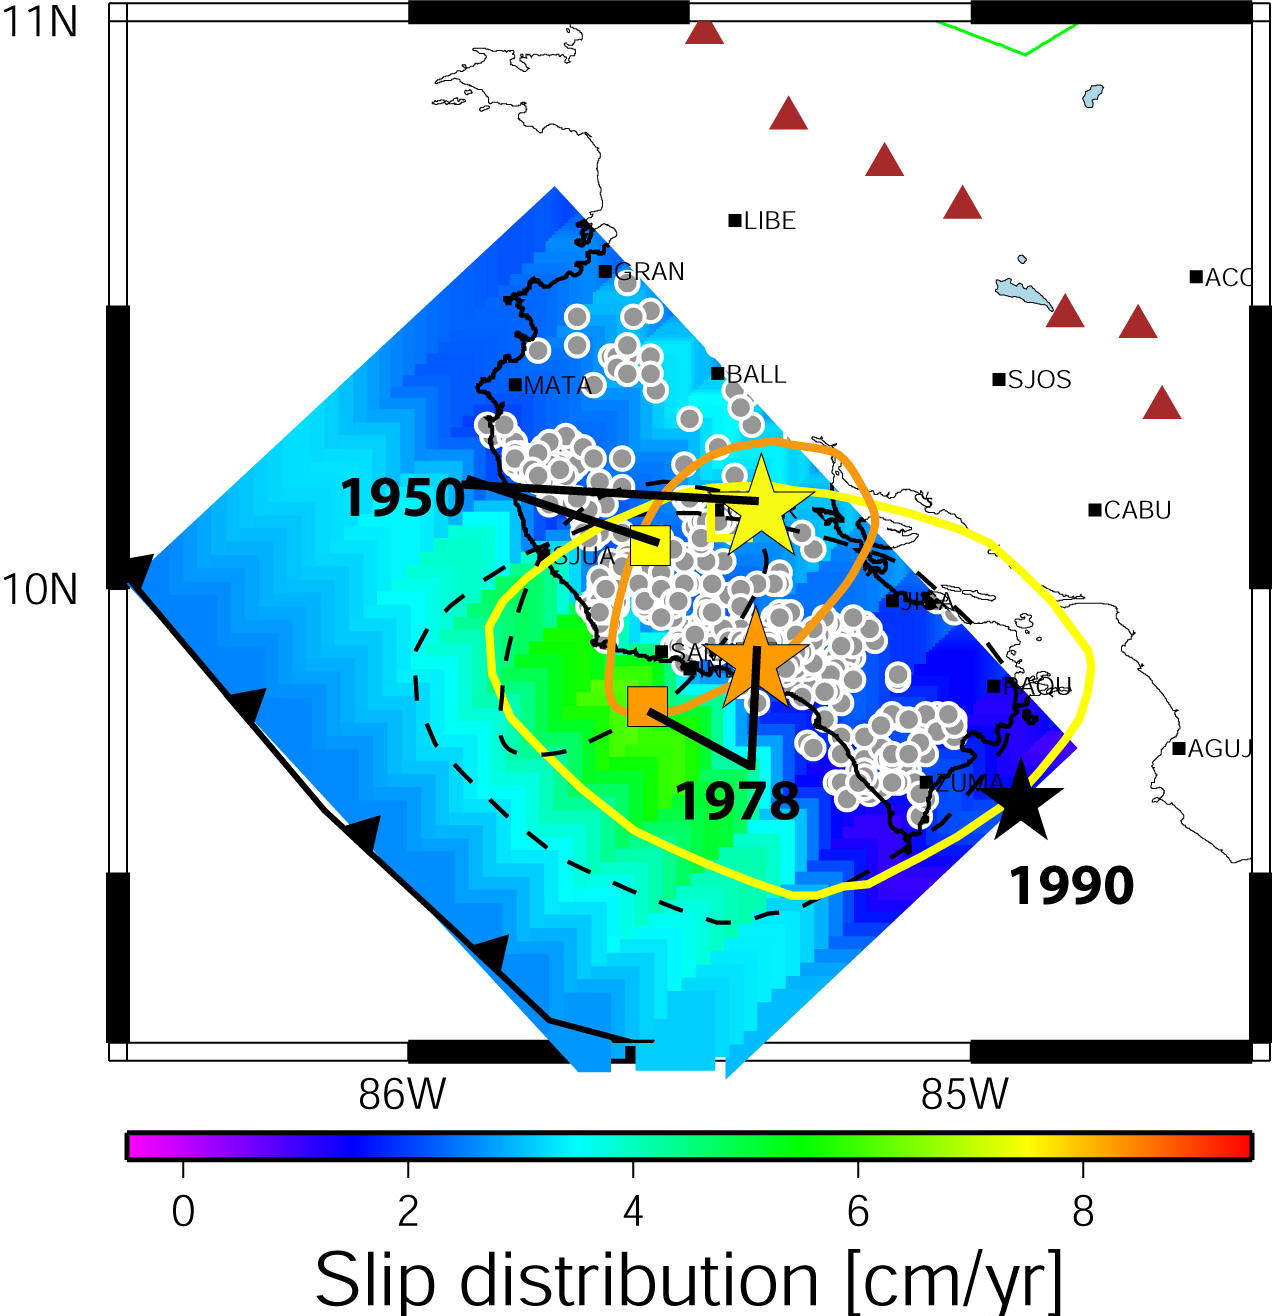
Comparison of distribution of locking on the plate interface
(thrust fault) from inversion of GPS data, well-located earthquakes
(small white cirlces) from our seismic network (both
on-land and offshore (OBS) seismic instruments), and
rupture areas of past earthquakes, from Norabuena et al. [2004].
Original ISC (boxes) and relocated (stars) epicenters
and corresponding rupture areas from aftershock distribution
(dashed lines are original, colored solid lines are relocated)
for the 1950 (Mw = 7.7; yellow) and 1978 (Mw = 7.0; orange)
Nicoya earthquakes. Epicenters and rupture areas are relocated
relative to the well-located 1990 Mw = 7.0 Gulf of Nicoya event
(black star). Note that the locked portion of the northeast-dipping
plate interface (green) is well up-dip of the interseismic
microearthquakes. This suggests that the up-dip limit of the seismogenic
zone is not defined well by this type of seismicity, but is well-defined
either by the locked portion of the plate boundary, as measured
by GPS, or by the aftershock distribution following a major earthquake,
as outlined by seismic instruments. The interseismic microearthquakes
likely indicate regions of the plate boundary that are slipping,
and hence not accumulating seismic strain as fast as the up-dip portion.
This project is a collaboration between OVSICORI, the University
of California at Santa Cruz, and the University of Miami Geodesy
Lab.
2.
Crustal Deformation and Strain Accumulation GPS data can
be used to measure strain accumulation near active faults,
the process responsible for earthquakes. The data can be used
to determine the slip rate of the fault, its subsurface geometry
and locking depth, the pattern of locking on the fault (Figure
2.1), which may be related to the pattern of energy release in subsequent
earthquakes, and details concerning the rheology (material properties)
of rocks around the fault. An example of strain accumulation
on the San Andreas fault in California is shown in Figure 2.2, from
Schmalzle et al. [2006],
based on data collected by the Miami Geodesy lab and other sources.
The Geodesy Lab has active programs related to strain accumulation
in Costa Rica [Norabuena et
al., 2004] in collaboration with OVSICORI; in Iceland
[LaFemina et al., 2005] in
collaboration with NORDVULC; in California [Dixon et al., 2000; Malservisi et al.,
2001; Schmalzle et al., 2006]; in Utah and Nevada
[Malservisi et al., 2003];
and in Baja California, Mexico [Dixon
et al., 2000, 2002] in collaboration with CICESE.
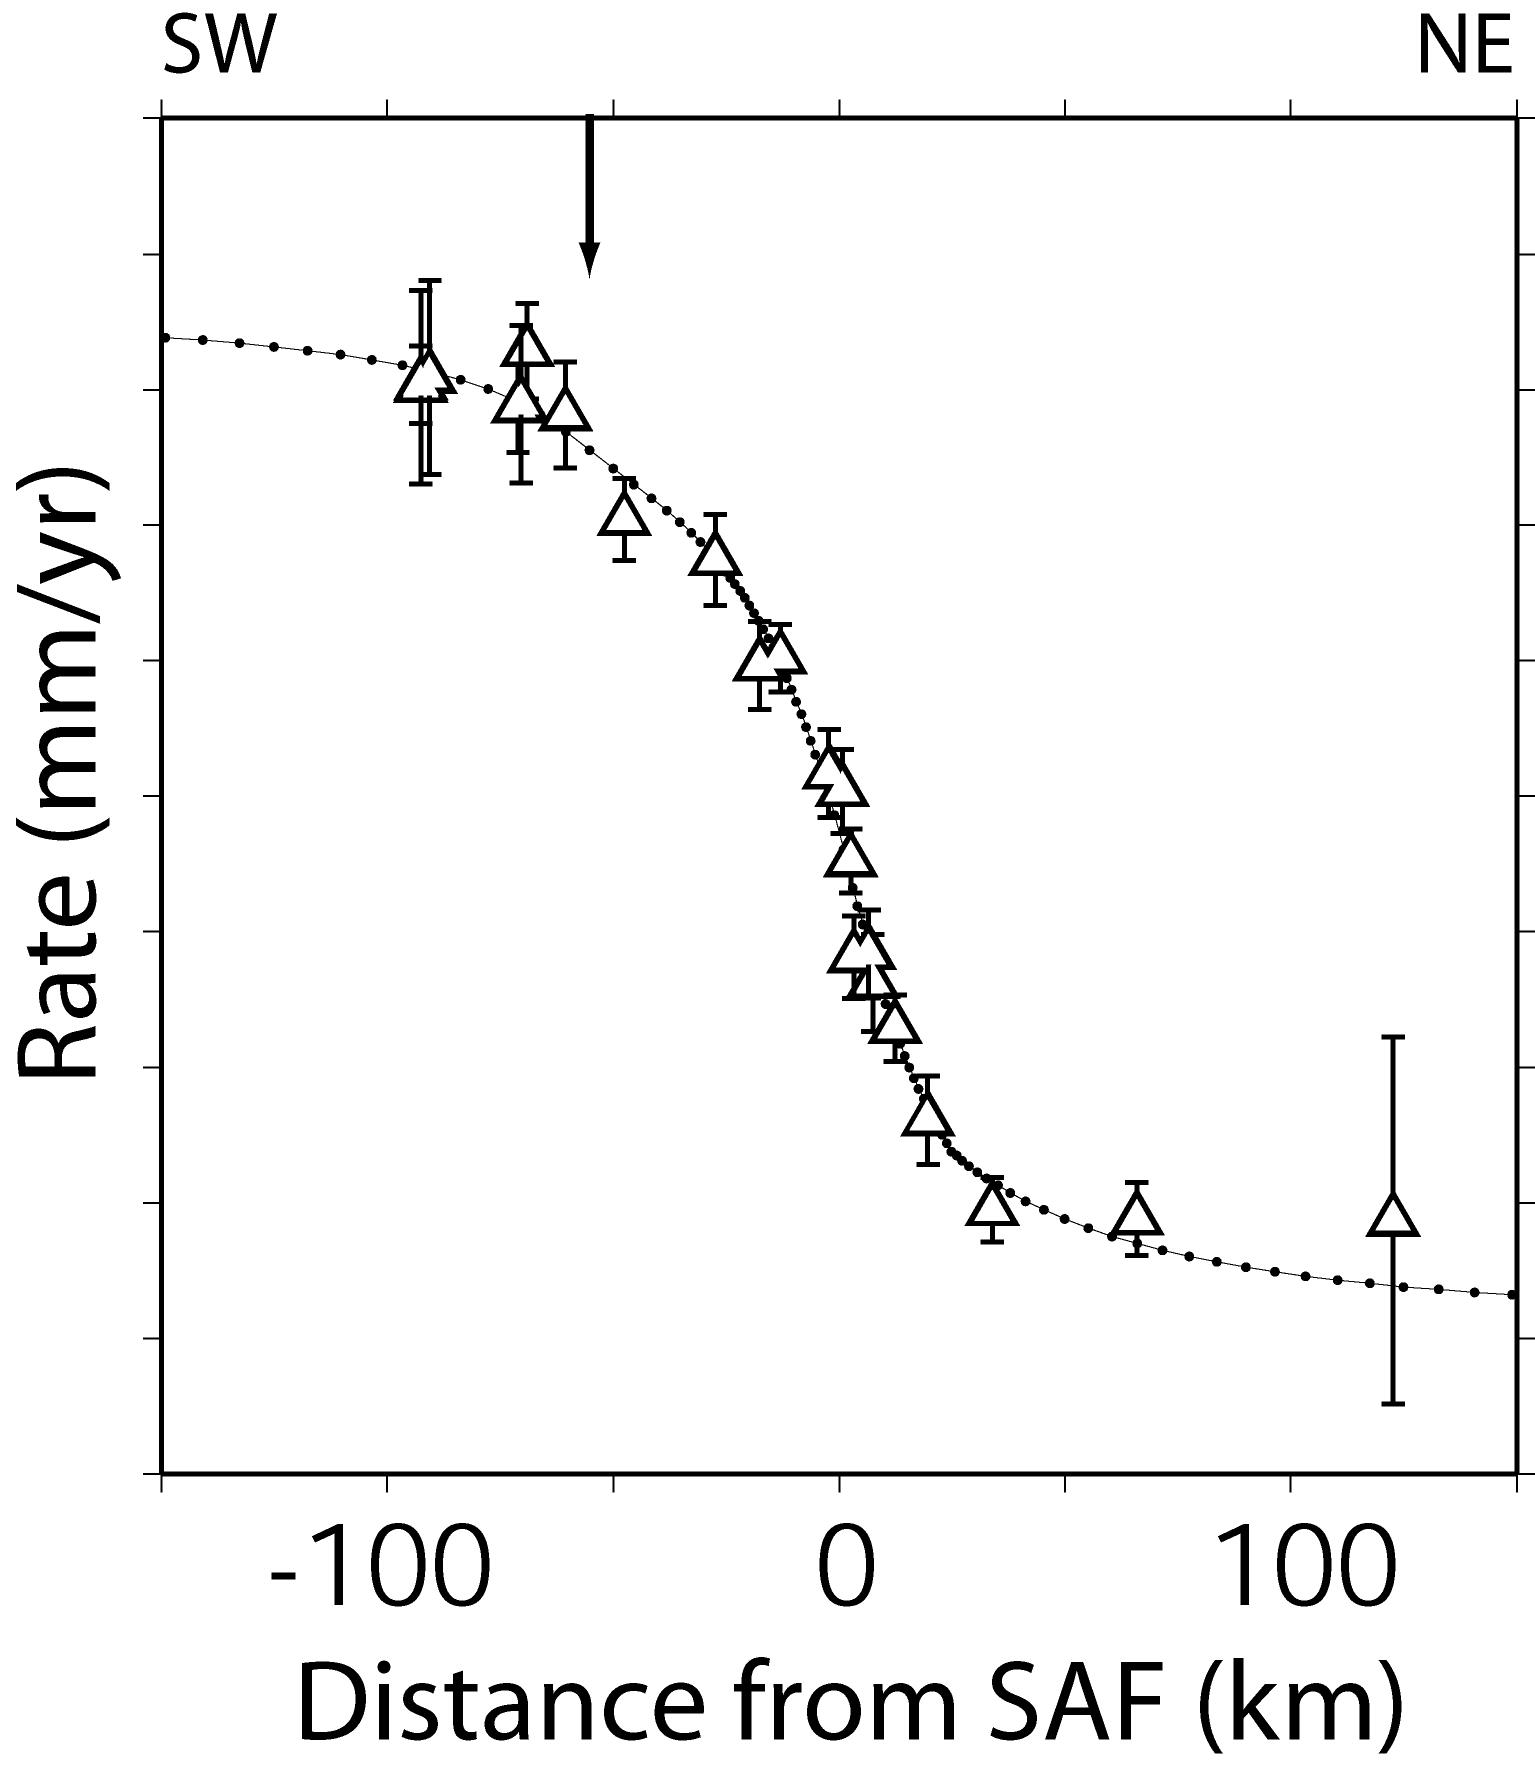
GPS data compared to best fit finite element model, assuming different
elastic properties in the upper crust on each side of the fault.
Model accounts for strike-slip movement on the SAF (located
at 0 km on the horizontal axis) as well as the Los Alamos Fault
(at -59 km). The model is consistent with geologic, laboratory,
paleoseismic, seismic and magnetotelluric data and is also
the minimum misfit solution for the GPS data (chi2 = 9.30, reduced_chi2
= 0.58). [Schmalze et al 2006]